DEFINITION:
The Performance Score is a comprehensive metric (0-100) that combines multiple risk-adjusted metrics into a single number. Learn how it's calculated and how to interpret it.
Performance Score
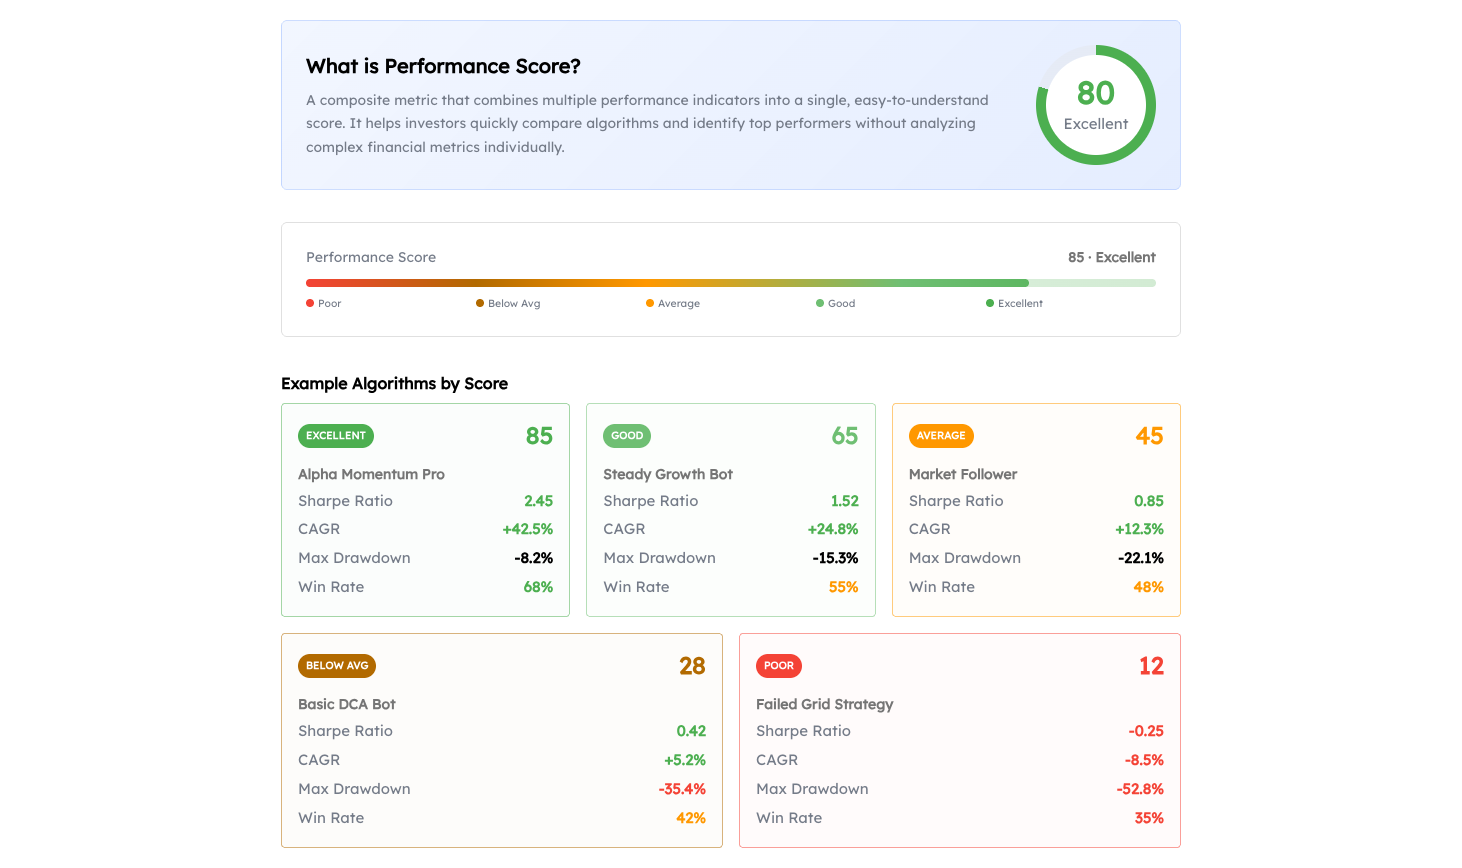
The Performance Score is a comprehensive metric that provides a single number (0-100) representing the overall quality of a trading bot's performance. It combines multiple risk-adjusted metrics into one easy-to-understand score, making it simple to compare different trading strategies at a glance.
Why Use a Performance Score?
Evaluating a trading bot requires analyzing many different metrics—returns, risk, consistency, and resilience. Each metric tells only part of the story:
- High returns might come with excessive risk
- Low drawdowns might mean overly conservative strategies
- High win rates don't guarantee profitability
The Performance Score solves this by combining the most important metrics into a single, balanced score that considers all aspects of performance.
How Is the Performance Score Calculated?
The Performance Score is a weighted average of six normalized metrics:
| Metric | Weight | What It Measures |
|---|---|---|
| Sharpe Ratio | 25% | Risk-adjusted return (most widely used) |
| Sortino Ratio | 20% | Downside risk-adjusted return |
| Calmar Ratio | 15% | Return relative to maximum drawdown |
| CAGR | 15% | Compound annual growth rate |
| Win Rate | 15% | Percentage of profitable trades |
| Recovery Factor | 10% | Ability to recover from losses |
Normalization Process
Each metric is normalized to a 0-100 scale before applying weights:
- Sharpe Ratio: -2 to 4 → 0 to 100
- Sortino Ratio: -2 to 4 → 0 to 100
- Calmar Ratio: 0 to 5 → 0 to 100
- CAGR: -50% to 100% → 0 to 100
- Win Rate: Already 0-100%
- Recovery Factor: 0 to 5 → 0 to 100
The Formula
Performance Score = (Sharpe × 0.25) + (Sortino × 0.20) + (Calmar × 0.15)
                  + (CAGR × 0.15) + (WinRate × 0.15) + (Recovery × 0.10)
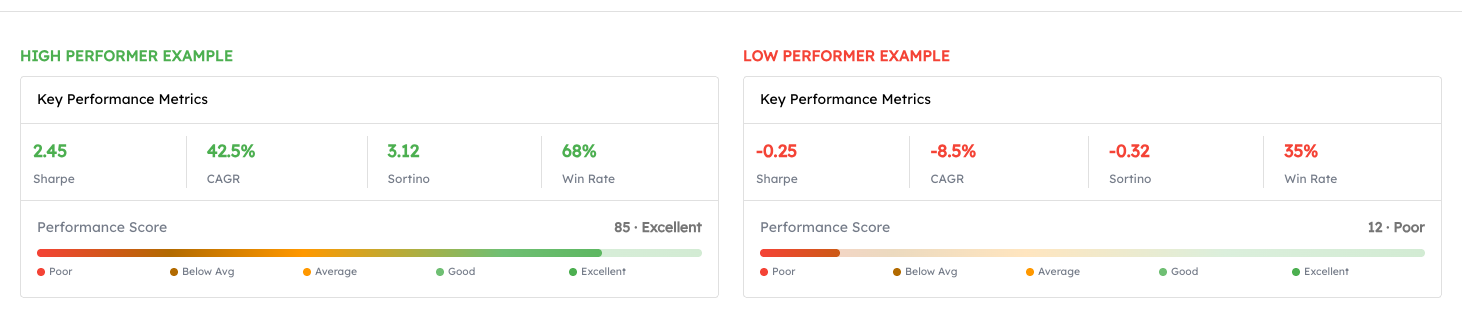
Interpreting the Performance Score
| Score Range | Rating | Interpretation |
|---|---|---|
| 80-100 | Excellent | Outstanding performance across all metrics |
| 60-79 | Good | Strong performance with minor weaknesses |
| 40-59 | Average | Moderate performance, room for improvement |
| 20-39 | Below Average | Significant concerns in multiple areas |
| 0-19 | Poor | Major issues requiring attention |
Component Metrics Explained
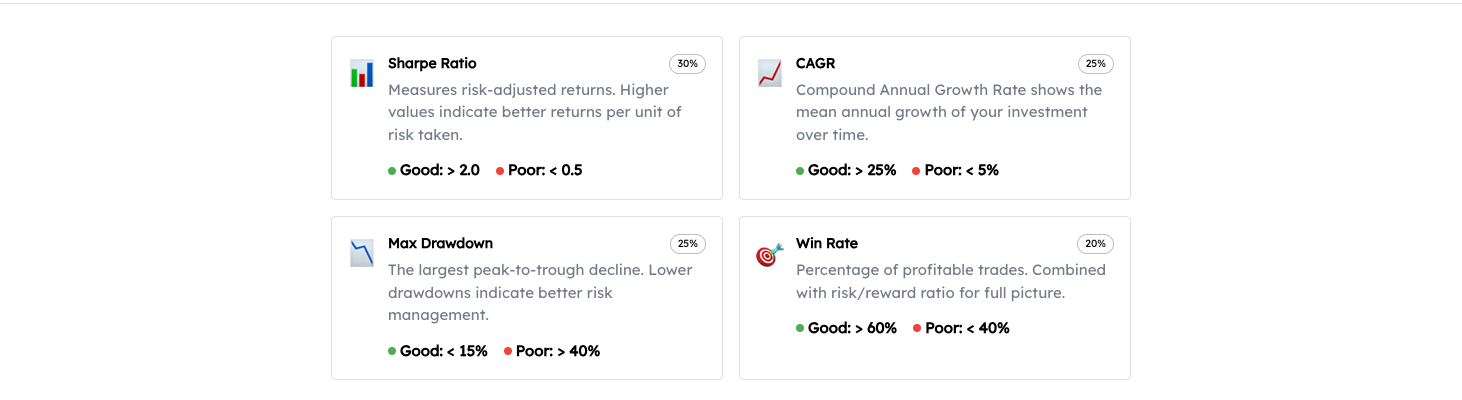
Sharpe Ratio (25% Weight)
The Sharpe Ratio measures risk-adjusted returns by comparing excess returns to volatility. A higher Sharpe ratio indicates better returns per unit of risk.
- Above 2.0: Excellent
- 1.0 to 2.0: Good
- 0.5 to 1.0: Average
- Below 0.5: Poor
Sortino Ratio (20% Weight)
The Sortino Ratio is similar to Sharpe but only considers downside volatility. This makes it particularly useful for strategies that have asymmetric return distributions.
Calmar Ratio (15% Weight)
The Calmar Ratio divides the CAGR by the maximum drawdown. It measures how well the strategy performs relative to its worst-case scenario.
CAGR (15% Weight)
The Compound Annual Growth Rate represents the average annual return if profits were reinvested. It provides a standardized way to compare returns across different time periods.
Win Rate (15% Weight)
The Win Rate measures the percentage of profitable trades. While high win rates don't guarantee profitability, they indicate trading consistency.
Recovery Factor (10% Weight)
The Recovery Factor measures how quickly a strategy recovers from drawdowns. A higher recovery factor indicates greater resilience and the ability to bounce back from losses.
Why These Weights?
The weighting system prioritizes risk-adjusted metrics:
-
Sharpe Ratio (25%) gets the highest weight because it's the most comprehensive single measure of risk-adjusted performance and is universally used in the investment industry.
-
Sortino Ratio (20%) receives significant weight because it specifically penalizes downside risk, which matters most to investors.
-
Calmar Ratio (15%) ensures strategies with large drawdowns are appropriately penalized.
-
CAGR (15%) represents raw returns—ultimately what investors seek.
-
Win Rate (15%) indicates trading consistency and psychological comfort.
-
Recovery Factor (10%) measures resilience but receives lower weight since it's partially captured by other metrics.
Limitations
While the Performance Score is a powerful tool, keep these limitations in mind:
- Historical basis: The score is based on past performance, which doesn't guarantee future results
- Time sensitivity: Recent performance may differ from the overall score
- Market conditions: A strategy might score well in certain market conditions but poorly in others
- Strategy type: Different strategy types (trend-following vs. mean-reversion) may have different typical scores
Best Practices
-
Compare similar strategies: Use the score to compare strategies with similar investment horizons and risk profiles
-
Look at the components: A high overall score with one weak component might indicate a specific risk
-
Consider market conditions: Evaluate how the score changes across different market regimes
-
Monitor over time: Track how the score evolves as the strategy continues trading
-
Combine with qualitative analysis: The score should complement, not replace, understanding the strategy's logic
Conclusion
The Performance Score provides a quick, comprehensive way to evaluate trading bot performance. By combining multiple metrics with appropriate weights, it offers a balanced view of returns, risk, consistency, and resilience. Use it as a starting point for comparison, then dive deeper into individual metrics for strategies that interest you.
Table of Contents
Performance Score
Why Use a Performance Score?
How Is the Performance Score Calculated?
Interpreting the Performance Score
Component Metrics Explained
Why These Weights?
Limitations
Best Practices
Conclusion
About the Author
Marc van Duyn
Founder & CEOMarc is the Founder and CEO of Finterion. He is passionate about making algorithmic trading accessible to everyone.