
How to Evaluate a Trading Bot
A complete guide to selecting the right bot. Learn to analyze CAGR, Sharpe ratio, drawdown, and other key metrics.
Marc van Duyn
•
2026-01-09
How to Evaluate a Trading Bot
Selecting the right trading bot can be the difference between growing your wealth and losing your investment. With countless options available, understanding how to properly evaluate trading bot performance is essential. This guide walks you through the key metrics, red flags, and best practices for selecting a trading bot that matches your investment goals.
The Evaluation Framework
Before diving into specific metrics, understand that no single number tells the whole story. Evaluating a trading bot requires analyzing multiple dimensions:
| Dimension | Key Questions |
|---|---|
| Returns | How much profit does it generate? |
| Risk | What's the worst-case scenario? |
| Consistency | How reliable is the performance? |
| Efficiency | Are returns worth the risk taken? |
| Sustainability | Will performance continue? |
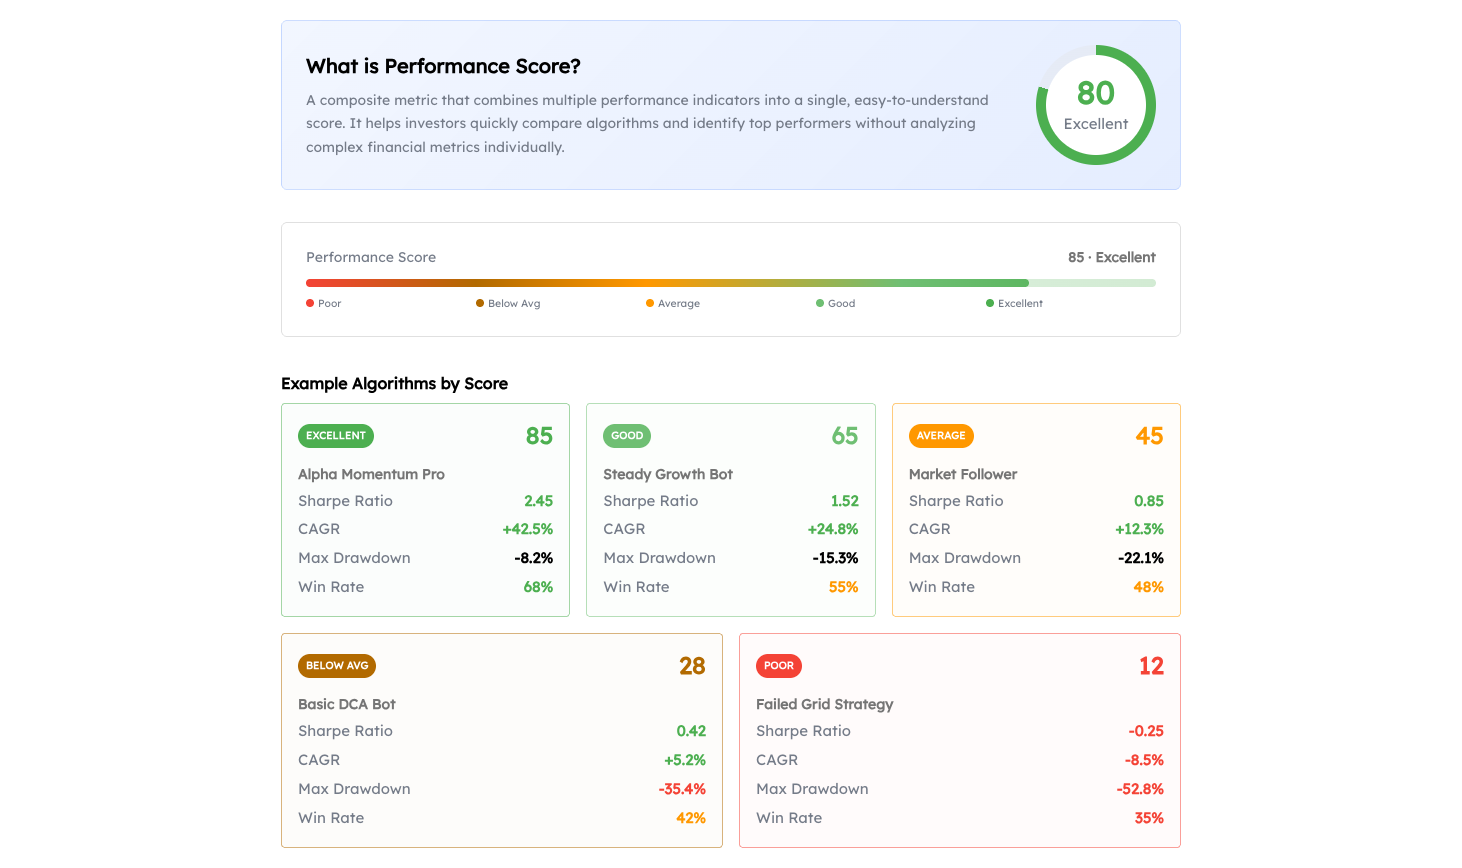
Our Performance Score combines these dimensions into a single 0-100 metric, making it easy to compare bots at a glance.
Essential Metrics to Analyze
1. CAGR (Compound Annual Growth Rate)
What it measures: The smoothed annual return rate, accounting for compounding.
Why it matters: CAGR allows fair comparison between bots running for different time periods.
| CAGR Range | Crypto Bots | Traditional Markets |
|---|---|---|
| < 0% | Losing money | Losing money |
| 0-10% | Below average | Average |
| 10-25% | Good | Excellent |
| 25-50% | Very good | Outstanding |
| 50-100% | Excellent | Exceptional (verify risk) |
| > 100% | Outstanding | Unrealistic (investigate) |
Red flags:
- Extremely high CAGR (>200%) without corresponding high drawdown
- CAGR calculated over very short periods (<6 months)
- No clear explanation of how returns are generated
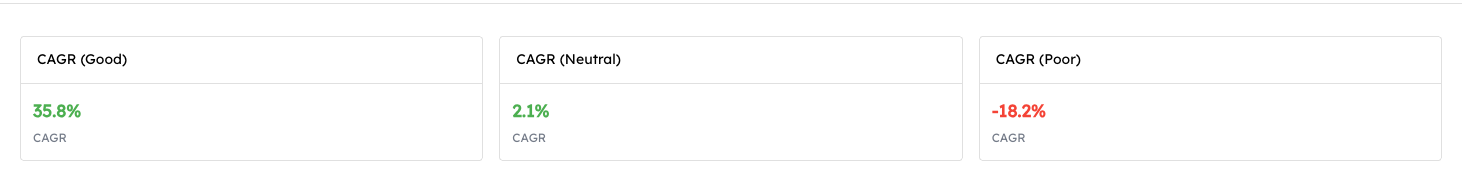
The image above shows CAGR values across different performance levels. Green indicates strong growth, while red signals losses.
📊 Learn more: CAGR Explained
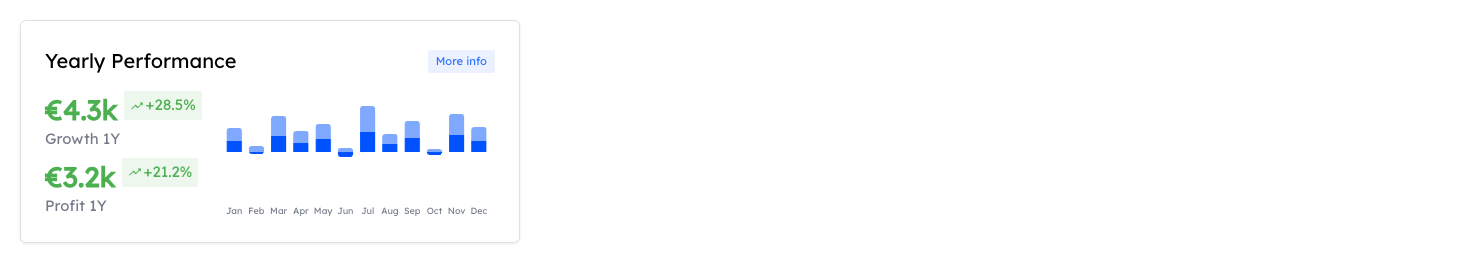
2. Yearly Performance
The Yearly Performance card shows monthly profit and growth data over the past 12 months. This visualization helps you understand how consistent returns are throughout the year.
What to look for:
- Consistent positive months rather than a few big wins
- How the bot performs in both up and down markets
- The relationship between growth and profit percentages
A bot with steady monthly returns is often preferable to one with volatile swings, even if the total returns are similar.
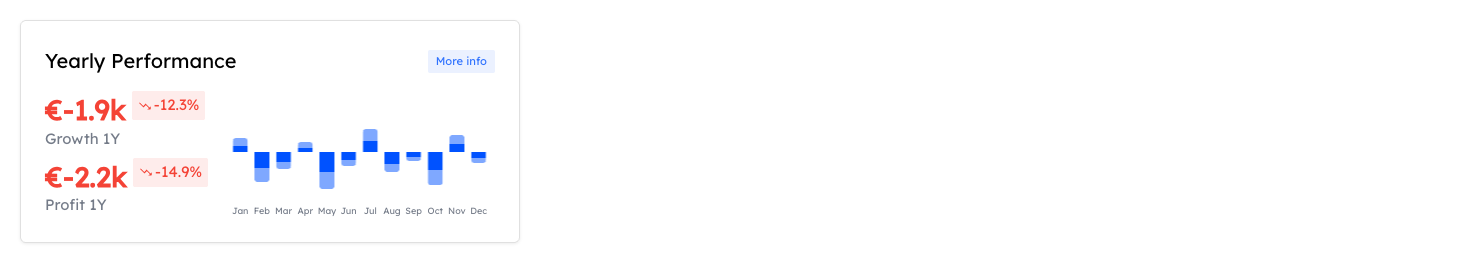
Warning signs: If you see many consecutive negative months, investigate what market conditions caused the losses and whether the strategy has adapted.
3. Sharpe Ratio
What it measures: Risk-adjusted returns. How much return you get per unit of risk.
Where:
- = Portfolio return
- = Risk-free rate
- = Portfolio standard deviation
Why it matters: A bot with 50% returns and wild swings may be worse than one with 25% returns and steady growth.
| Sharpe Ratio | Interpretation |
|---|---|
| < 0 | Returns below risk-free rate |
| 0 - 1 | Suboptimal risk-adjusted returns |
| 1 - 2 | Good risk-adjusted returns |
| 2 - 3 | Very good |
| > 3 | Excellent (but verify authenticity) |
What to look for:
- Sharpe > 1 for most strategies
- Higher Sharpe for lower-volatility strategies
- Consistent Sharpe across different time periods
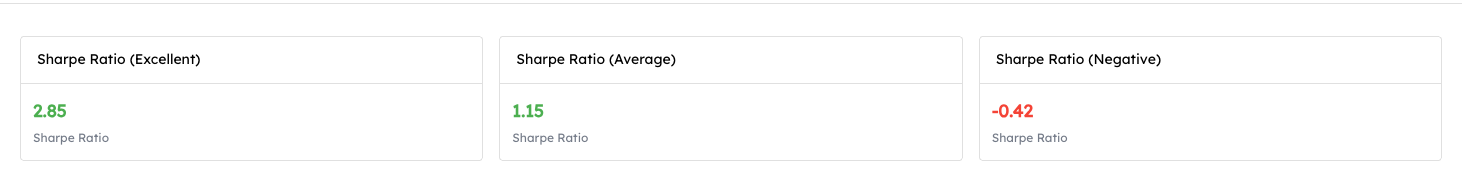
Sharpe Ratio ranges from excellent (2.85) to negative (-0.42). A ratio above 1 is generally considered good; above 2 is excellent.
📊 Learn more: Sharpe Ratio Explained
4. Maximum Drawdown and Risk Score
What it measures: The largest peak-to-trough decline. Your worst-case loss.
Why it matters: This is the pain you must endure. If a bot has a 50% max drawdown, you need to be prepared to see half your investment disappear (temporarily).
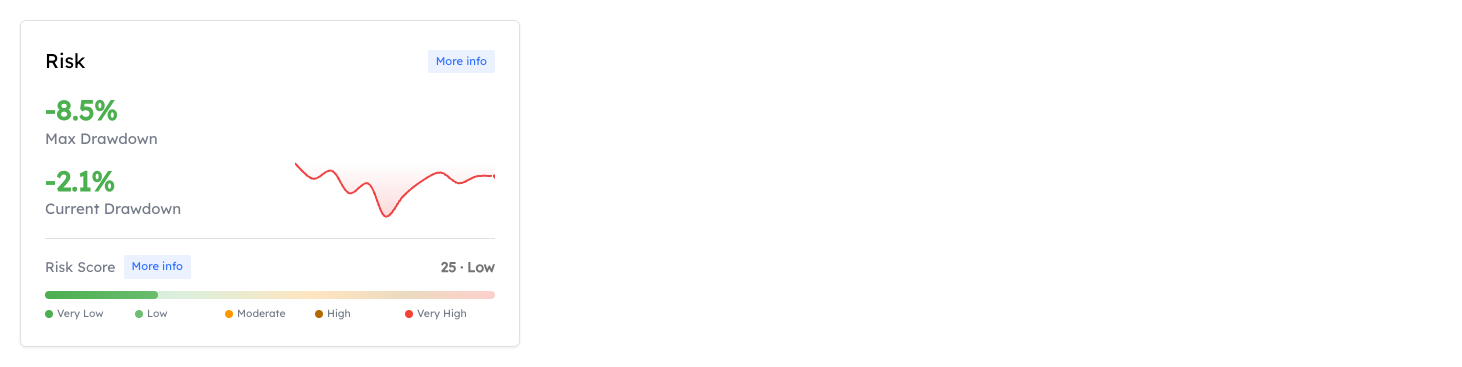
The Risk card shows both the maximum drawdown and current drawdown, along with a Risk Score that summarizes overall risk level. Lower risk scores (green) indicate more conservative strategies.
| Max Drawdown | Risk Level | Suitable For |
|---|---|---|
| < 10% | Conservative | Risk-averse investors |
| 10-20% | Moderate | Balanced portfolios |
| 20-35% | Aggressive | Growth-focused investors |
| 35-50% | High Risk | Speculative allocation only |
| > 50% | Extreme | Not recommended for most |
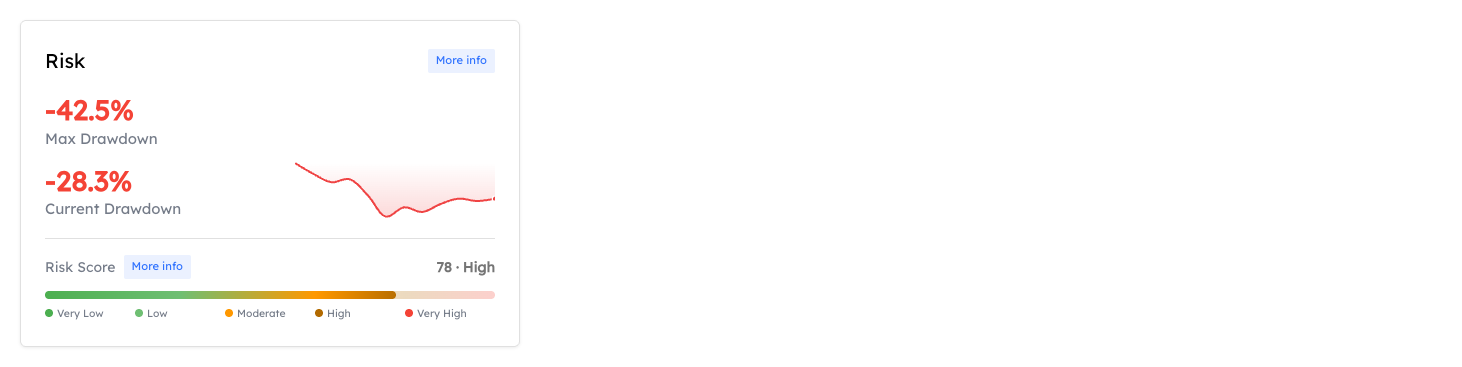
Critical questions:
- How long did recovery take after the max drawdown?
- What market conditions caused the drawdown?
- How does max drawdown compare to CAGR? (See Calmar Ratio below)
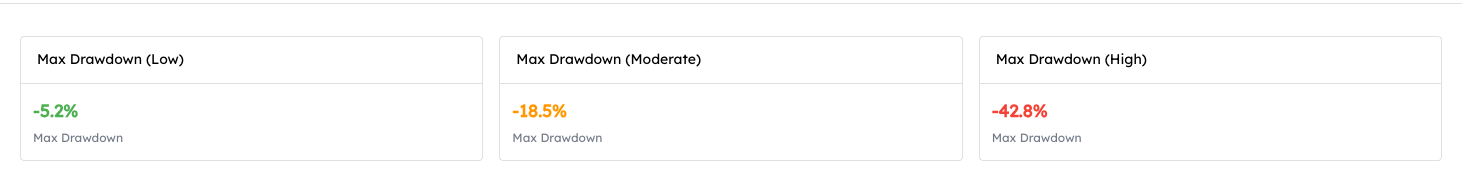
Max Drawdown comparison showing low (-5.2%), moderate (-18.5%), and high (-42.8%) levels. Lower drawdowns (green) indicate more conservative risk management.
📊 Learn more: Drawdown Explained
5. Volatility
What it measures: How much returns fluctuate. The "bumpiness" of the ride.
Why it matters: High volatility means unpredictable returns. Even with good average returns, you might experience significant short-term losses.
| Annual Volatility | Risk Level |
|---|---|
| < 10% | Low volatility |
| 10-20% | Moderate |
| 20-40% | High (typical for crypto) |
| > 40% | Very high |
Comparison benchmark:
- S&P 500 historical volatility: ~15-20%
- Bitcoin historical volatility: ~60-80%

Volatility comparison showing low (8.5%), moderate (28.5%), and high (65.2%) levels. Lower volatility (green) means smoother, more predictable returns.
📊 Learn more: Volatility Explained
6. Sortino Ratio
What it measures: Like Sharpe Ratio, but only penalizes downside volatility (the bad kind).
Where = downside deviation (volatility of negative returns only)
Why it matters: A bot with volatile upside but stable downside is better than one with equal up and down volatility. Sortino captures this.
| Sortino Ratio | Interpretation |
|---|---|
| < 0 | Negative returns |
| 0 - 1 | Below average |
| 1 - 2 | Good |
| 2 - 3 | Very good |
| > 3 | Excellent |
Sortino vs Sharpe:
- Sortino > Sharpe suggests upside volatility (good)
- Sortino < Sharpe suggests downside volatility (bad)
- Sortino ≈ Sharpe suggests symmetric volatility
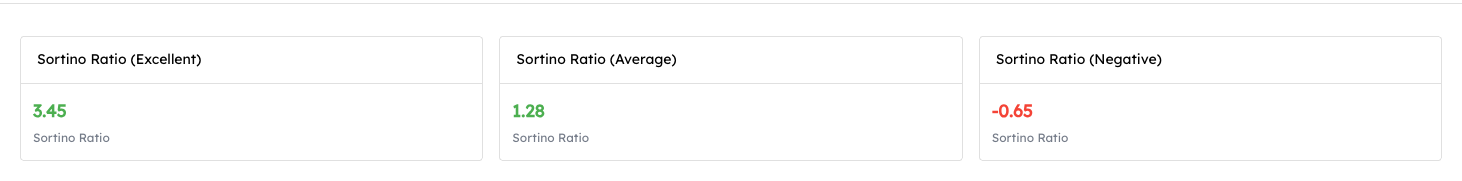
Sortino Ratio comparison from excellent (3.45) to negative (-0.65). Like Sharpe, higher is better, but Sortino specifically measures downside risk.
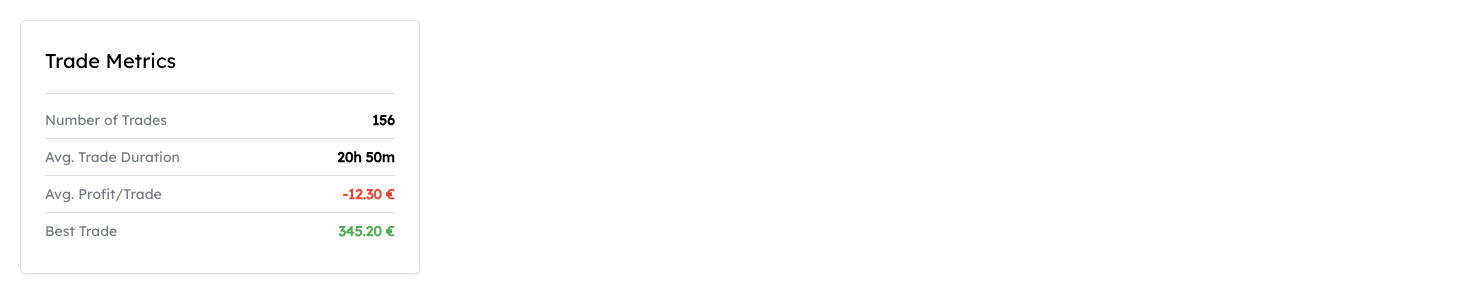
7. Win Rate and Trade Metrics
What it measures: Percentage of trades that are profitable.
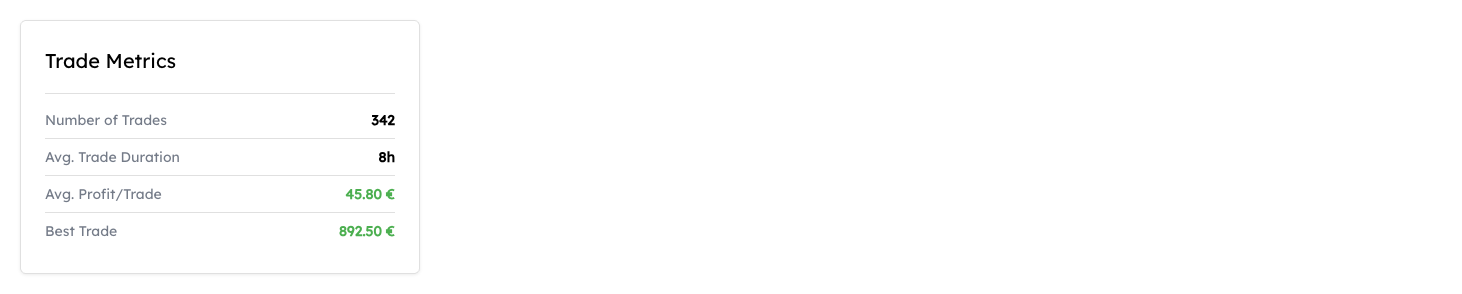
Why it matters: Indicates consistency, but must be evaluated with average win/loss size.
| Win Rate | Interpretation | Required Risk-Reward |
|---|---|---|
| 30-40% | Low, needs high R:R | 2:1 or higher |
| 40-50% | Moderate | 1.5:1 or higher |
| 50-60% | Good | 1:1 or higher |
| 60-70% | Very good | Any positive R:R |
| > 70% | Excellent | Verify loss sizes |
Critical insight: A 40% win rate can be more profitable than 70% if the average win is much larger than the average loss.
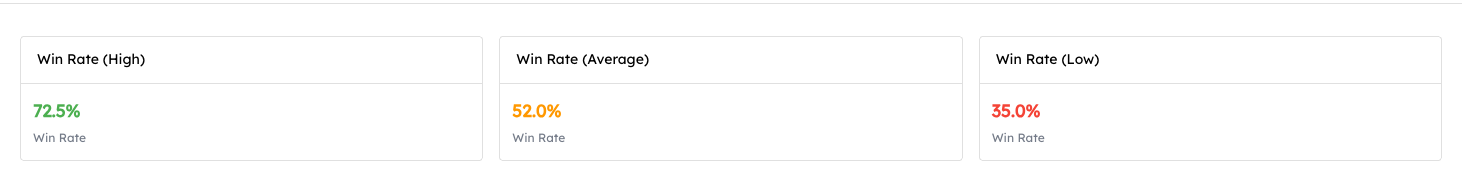
Win Rate comparison showing high (72.5%), average (52%), and low (35%) levels. Context matters: a lower win rate with larger average wins can outperform a higher win rate with smaller wins.
📊 Learn more: Win Rate Explained
Advanced Metrics
Calmar Ratio
Formula: CAGR ÷ Max Drawdown
Why it matters: Directly compares returns to worst-case loss.
| Calmar Ratio | Interpretation |
|---|---|
| < 0.5 | Poor risk-return |
| 0.5 - 1 | Acceptable |
| 1 - 2 | Good |
| > 2 | Excellent |
Example:
- Bot A: 30% CAGR, 15% Max Drawdown → Calmar = 2.0
- Bot B: 50% CAGR, 40% Max Drawdown → Calmar = 1.25
- Bot A is more efficient despite lower absolute returns
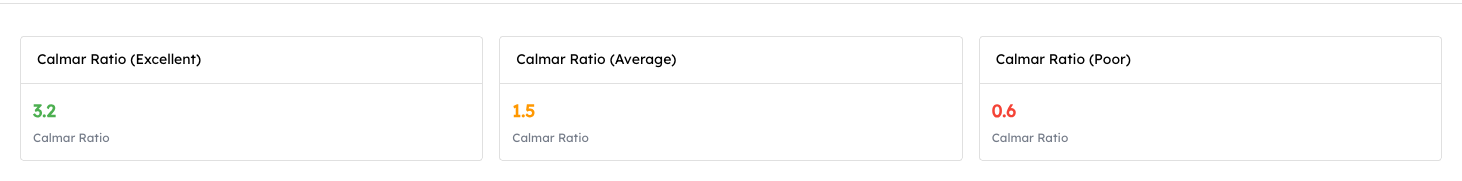
Calmar Ratio comparison from excellent (3.2) to poor (0.6). A ratio above 1 means your annual returns exceed your worst loss; above 2 is considered excellent.
Profit Factor
Formula: Gross Profits ÷ Gross Losses
| Profit Factor | Interpretation |
|---|---|
| < 1.0 | Losing money |
| 1.0 - 1.5 | Marginal |
| 1.5 - 2.0 | Good |
| > 2.0 | Excellent |
Recovery Factor
Formula: Net Profit ÷ Max Drawdown
Shows how many times the bot has "earned back" its worst loss. Higher is better.
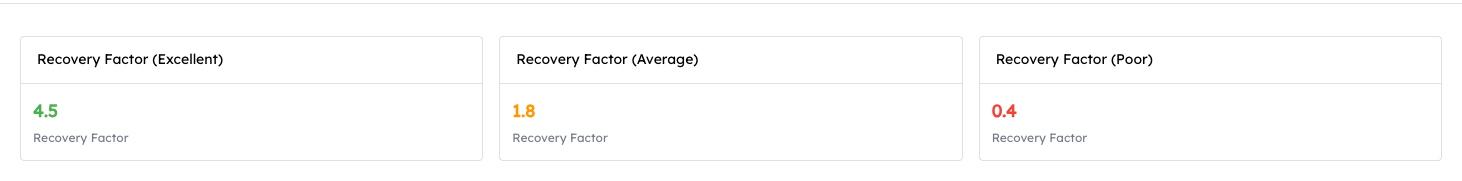
Recovery Factor comparison from excellent (4.5) to poor (0.4). A factor above 2 indicates the bot has recovered its worst loss multiple times, demonstrating resilience.
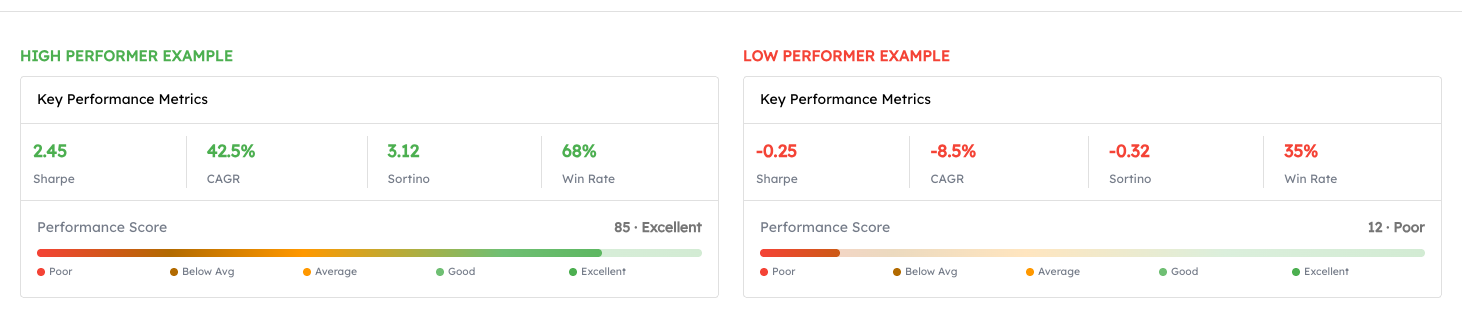
Putting It All Together
When evaluating a trading bot, view all metrics together. Here's how they typically appear on an algorithm page:
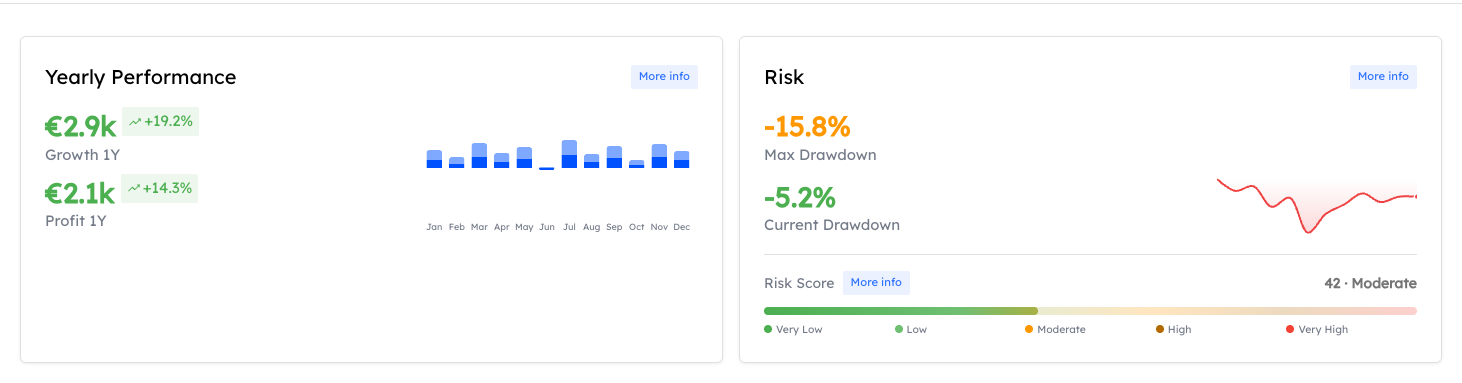
This side-by-side view lets you quickly assess both returns (Yearly Performance) and risk (Drawdown and Risk Score) to make an informed decision.
The Evaluation Checklist
Use this checklist when evaluating any trading bot:
Performance Metrics ✓
- CAGR is realistic for the market (not too good to be true)
- Sharpe Ratio > 1 (preferably > 1.5)
- Max Drawdown acceptable for your risk tolerance
- Sortino Ratio > Sharpe Ratio (or at least equal)
- Win Rate makes sense with average win/loss sizes
- Calmar Ratio > 1
Track Record ✓
- Minimum 12 months of live trading data
- Performance verified on real trades (not just backtests)
- Has experienced different market conditions (bull, bear, sideways)
- Drawdowns have recovered in reasonable time
Transparency ✓
- Clear explanation of strategy type
- Understandable risk factors
- Regular performance updates
- Accessible trade history
- Known team or developer
Technical ✓
- Reliable execution infrastructure
- Proper risk management (stop-losses, position limits)
- Security measures in place
- Clear fee structure
Red Flags to Avoid
🚩 Unrealistic Returns
- Claims of "guaranteed" profits
- 500%+ annual returns with no substantial drawdown
- Perfectly smooth equity curves
🚩 Lack of Transparency
- No verifiable track record
- Refusing to share drawdown data
- Vague strategy descriptions
🚩 Short Track Record
- Only backtested results
- Less than 6 months live trading
- Performance only during favorable conditions
🚩 Poor Risk Metrics
- Max drawdown > 50%
- Sharpe Ratio < 0.5 long-term
- Calmar Ratio < 0.5
🚩 Marketing Over Substance
- Focus on testimonials rather than data
- Pressure tactics to invest quickly
- No clear risk disclaimers
Comparing Multiple Bots
When comparing trading bots side by side, create a comparison matrix:
| Metric | Bot A | Bot B | Bot C | Your Preference |
|---|---|---|---|---|
| CAGR | 35% | 25% | 45% | Higher is better |
| Max Drawdown | 20% | 12% | 35% | Lower is better |
| Sharpe Ratio | 1.8 | 2.1 | 1.3 | Higher is better |
| Sortino Ratio | 2.2 | 2.5 | 1.5 | Higher is better |
| Win Rate | 55% | 62% | 48% | Context-dependent |
| Track Record | 18 mo | 36 mo | 8 mo | Longer is better |
In this example: Bot B appears best. Moderate returns but excellent risk-adjusted performance and longest track record.
Matching Bots to Your Goals
Conservative Investor
Priorities: Capital preservation, steady returns
Look for:
- Max Drawdown < 15%
- Sharpe Ratio > 2
- Low volatility strategies
- CAGR: 10-25% acceptable
Balanced Investor
Priorities: Growth with managed risk
Look for:
- Max Drawdown 15-25%
- Sharpe Ratio > 1.5
- Calmar Ratio > 1
- CAGR: 20-40%
Aggressive Investor
Priorities: Maximum growth, high risk tolerance
Look for:
- CAGR > 40%
- Willing to accept 30-40% drawdowns
- Sharpe Ratio > 1
- Short recovery periods after drawdowns
FAQs
How long should I observe a bot before investing?
At minimum, observe through one market cycle or 6-12 months of live trading. Backtests are useful but not sufficient. Live performance is what matters.
Should I diversify across multiple bots?
Yes. Diversifying across bots with different strategies reduces risk. Avoid bots that are highly correlated (e.g., all trend-following in the same market).
How much weight should I give to recent performance?
Recent performance matters, but don't chase returns. A bot that performed well last month might be due for a drawdown. Look at performance across different time periods and market conditions.
Is a higher win rate always better?
No. Win rate must be evaluated with average win and loss sizes. A 30% win rate with 4:1 average win/loss is more profitable than 70% with 1:4 average win/loss.
How often should I re-evaluate my trading bot?
Review monthly for basic health checks, quarterly for detailed performance analysis. Consider replacing bots that underperform their benchmarks for 2-3 consecutive quarters.
Related Topics
- Understanding Performance Score: How our composite score works
- What Is a Trading Bot?: Understand the basics
- CAGR: Detailed guide on compound growth
- Sharpe Ratio: Risk-adjusted returns explained
- Drawdown: Understanding maximum loss
- Win Rate: Trade consistency metrics
- Volatility: Return fluctuation analysis
The Bottom Line
Evaluating a trading bot requires looking beyond headline returns. The best bot for you is not necessarily the one with the highest CAGR, but the one that delivers consistent, risk-adjusted returns matching your investment goals and risk tolerance.
Key takeaways:
- Never rely on a single metric. Use CAGR, Sharpe, Drawdown, and Sortino together
- Longer track records with live trading data are more reliable
- Understand the strategy and its risks before investing
- Match the bot's risk profile to your personal risk tolerance
- Diversify across multiple strategies and bots
- Monitor regularly and be prepared to make changes
Remember: Past performance does not guarantee future results, but proper evaluation significantly improves your odds of success.
Related Documentation
Table of Contents
How to Evaluate a Trading Bot
The Evaluation Framework
Essential Metrics to Analyze
Advanced Metrics
Putting It All Together
The Evaluation Checklist
Red Flags to Avoid
Comparing Multiple Bots
Matching Bots to Your Goals
FAQs
Related Topics
The Bottom Line
About the Author
Marc van Duyn
Founder & CEOMarc is the Founder and CEO of Finterion. He is passionate about making algorithmic trading accessible to everyone.