
Understanding the Performance Score
Learn how the Performance Score combines Sharpe ratio, Sortino ratio, Calmar ratio, CAGR, win rate, and recovery factor into a single 0-100 score for easy trading bot comparison.
Marc van Duyn
•
2026-01-10
Understanding the Performance Score
You've found two trading bots. One has a Sharpe ratio of 1.8 but a 35% max drawdown. The other has a Sharpe of 1.2 but only 15% drawdown and a higher win rate. Which one is better?
This is the daily dilemma investors face: drowning in metrics like Sharpe ratio, Sortino ratio, CAGR, maximum drawdown, and win rate, with no clear way to compare them. The Performance Score solves this by combining all these factors into a single number from 0 to 100.
What is the Performance Score?
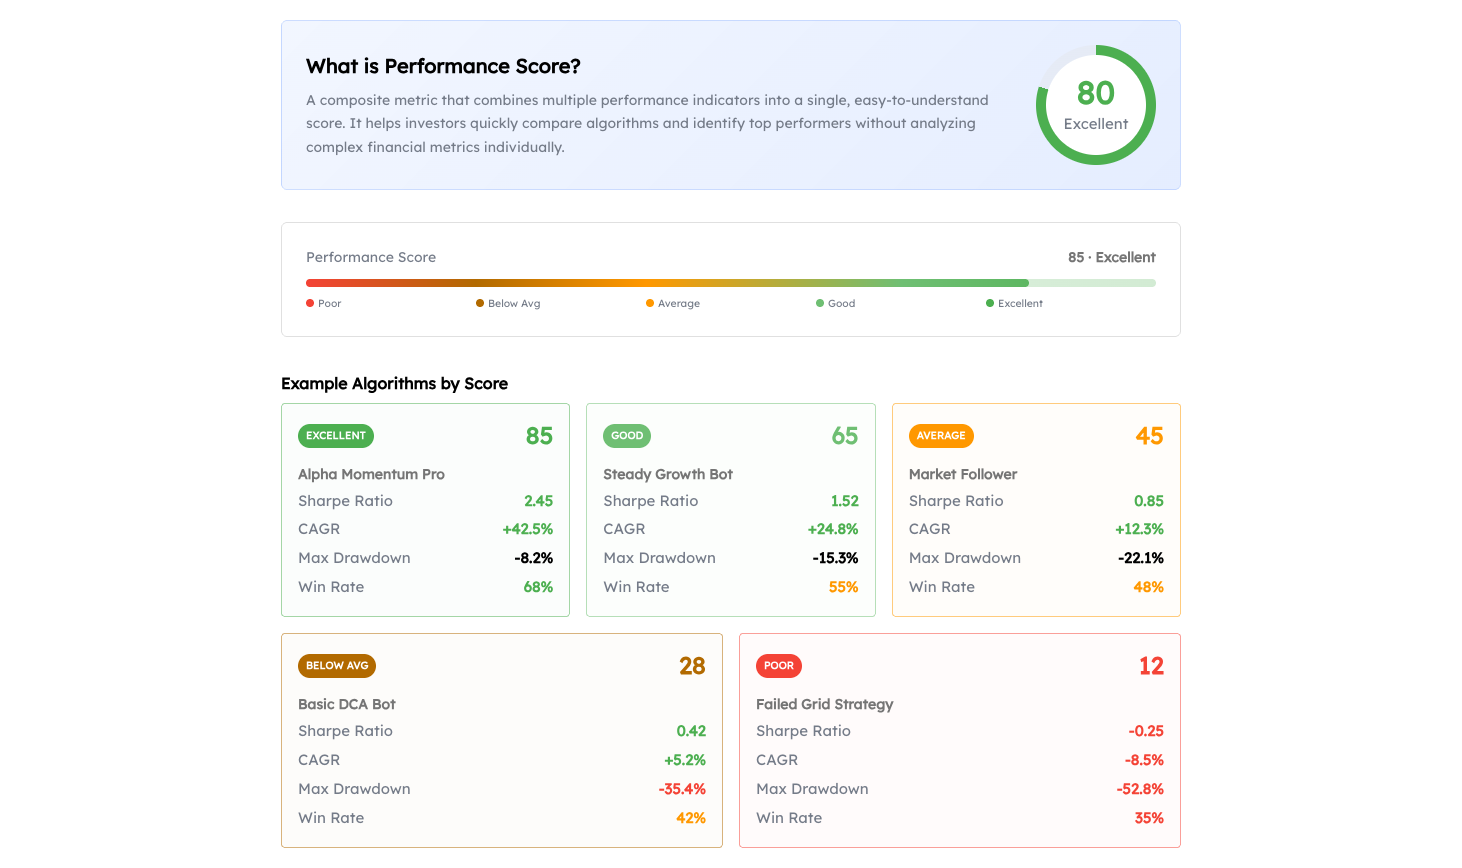
The Performance Score is a composite metric (0-100) that combines multiple risk-adjusted performance indicators into a single, easy-to-understand number. Rather than forcing you to analyze six different metrics and weigh their trade-offs yourself, the score does this automatically using a weighted average of normalized values.
The score helps you quickly compare algorithms without needing deep expertise in financial metrics. A score of 75 is better than a score of 50. It's that simple.
Score ranges:
- 80-100: Excellent. Top-tier performance, rare and exceptional
- 60-79: Good. Solid, consistent returns with manageable risk
- 40-59: Average. Moderate results, compare with alternatives
- 20-39: Below Average. Underperforming, needs careful review
- 0-19: Poor. High risk, significant issues detected
Why a Single Score?
Every popular metric has blind spots:
Sharpe Ratio treats all volatility equally, but upside volatility is good! A strategy with wild gains and stable losses gets penalized the same as one with stable gains and volatile crashes.
CAGR shows returns but ignores the journey. A 50% annual return means nothing if you experienced an 80% drawdown that made you panic-sell.
Win Rate sounds great at 85%, until you realize those wins average €10 while losses average €200.
Maximum Drawdown alone would make holding cash the "best" strategy: zero drawdown, zero returns.
The Performance Score balances all of these to give you the complete picture.
How It's Calculated
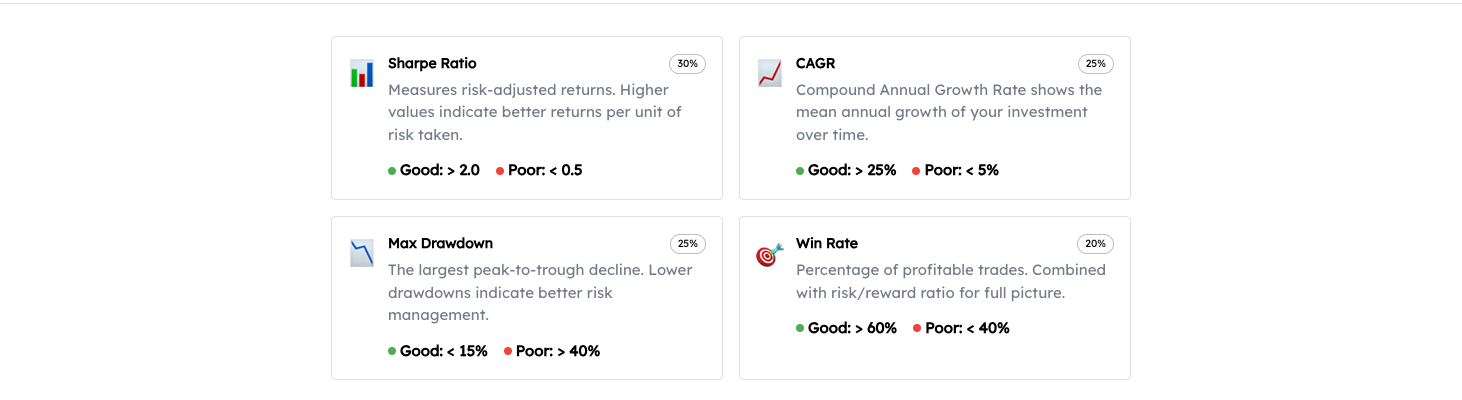
The Performance Score is a weighted average of six normalized metrics. Each metric is first normalized to a 0-100 scale, then combined using carefully chosen weights:
| Metric | Weight | Normalization Range | Why It Matters |
|---|---|---|---|
| Sharpe Ratio | 25% | -2 to 4 → 0-100 | The gold standard for risk-adjusted returns |
| Sortino Ratio | 20% | -2 to 4 → 0-100 | Focuses specifically on downside risk |
| Calmar Ratio | 15% | 0 to 5 → 0-100 | Keeps catastrophic drawdowns in check |
| CAGR | 15% | -50% to 100% → 0-100 | Ensures the strategy actually makes money |
| Win Rate | 15% | Already 0-100% | Trading consistency and fewer losing streaks |
| Recovery Factor | 10% | 0 to 5 → 0-100 | How quickly it bounces back from losses |
Example calculation: If an algorithm has a Sharpe ratio of 2.0, that falls at the 67% mark of the -2 to 4 range, giving a normalized score of ~67 for that component. This is then multiplied by the 25% weight and added to the other weighted components.
Reading the Score in Practice
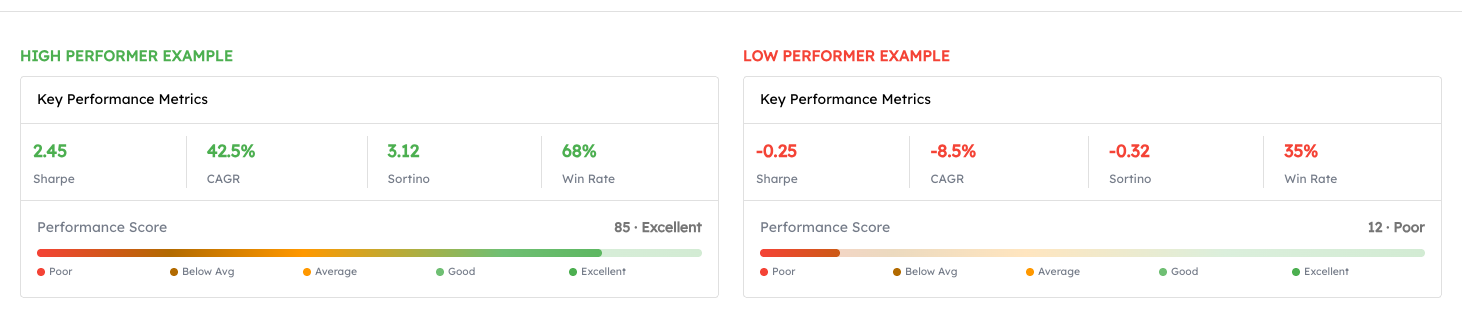
Most legitimate trading bots score between 40-70. Here's what to expect:
- Scores above 80 are rare and exceptional. Scrutinize them carefully
- Scores 60-80 indicate solid, reliable strategies
- Scores 40-60 are average. Compare with similar strategies
- Scores below 40 warrant caution and deeper investigation
The Score Is a Starting Point
The Performance Score helps you filter and compare, but it shouldn't replace due diligence. Always:
- Understand the underlying strategy
- Check the component metrics individually
- Consider your own risk tolerance
- Look at how the strategy performs in different market conditions
Ready to explore? Browse our algorithm store and see the Performance Score in action, or dive deeper into individual metrics in our learn section.
Questions about the Performance Score? Reach out at support@finterion.com
Related Documentation
Table of Contents
Understanding the Performance Score
What is the Performance Score?
Why a Single Score?
How It's Calculated
Reading the Score in Practice
The Score Is a Starting Point
About the Author
Marc van Duyn
Founder & CEOMarc is the Founder and CEO of Finterion. He is passionate about making algorithmic trading accessible to everyone.